Based on best available data as of 9/23/2021
- Download a PDF of the Western MA COVID-19 County Data Dashboard
-
Berkshire County COVID-19 data
-
Franklin County COVID-19 data
-
Hampden County COVID-19 data
-
Hampshire County COVID-19 data
Community-Level COVID-19 Data Over Time
Based on best available data as of 9/23/2021
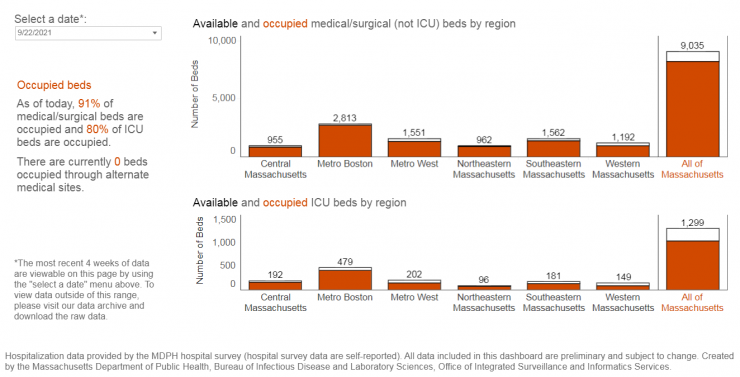
Hospital Capacity by Region
Based on best available data as of 9/23/2021

COVID-19 Vaccine
Based on best available data as of 9/23/21
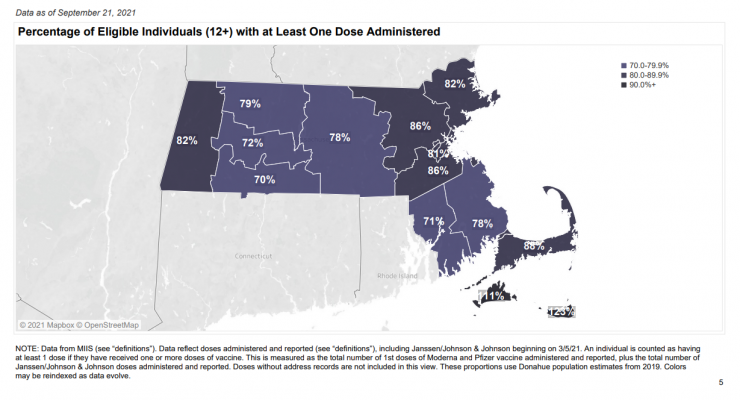
Percentage of Eligible Individuals (12+) with at Least One Vaccine Dose Administered by County of Resident Address

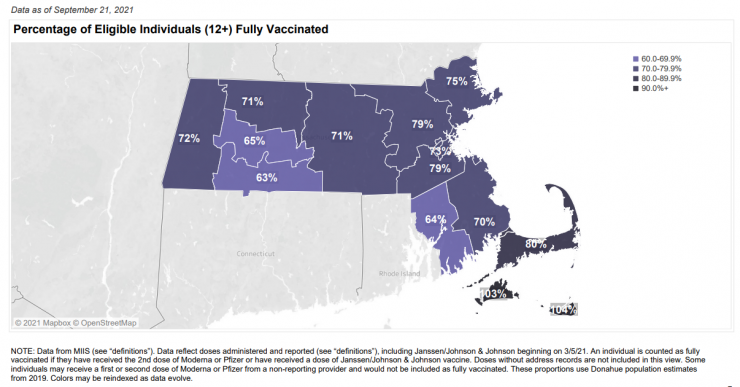
Percentage of Eligible Individuals (12+) Fully Vaccinated by County of Resident Address

Percentage of All Individuals with at Least One Vaccine Dose within Each Race/Ethnic Group by County of Resident Address

Data Sources and Notes
- Sources:
- MDPH Weekly COVID-19 Public Health Report. Current two week data is from most recent Public Health Report. Prior two week data is from prior week’s Public Health Report. Please note that there is an overlap in periods as MDPH reports weekly on rolling two week reporting periods, which they use for their comparisons. We report data in this way to be consistent with MDPH reporting.
- MDPH COVID-19 Daily Dashboard. Date corresponding to most recent MDPH Weekly COVID-19 Public Health Report.
- MDPH COVID-19 Interactive Data Dashboard
- MDPH Weekly COVID-19 Vaccination Report
- Comparisons to previous two-week period: Symbols indicate change when compared to prior two-week period. For new cases, incidence per 100,000, and total tests: Higher (upward arrow) means the number in the current two-week period is higher than the prior period. Lower (downward arrow) means the number in the current two-week period is lower than prior two-week period. No change (equal sign) means the number in the current two-week period is the same as the prior period. For percent positivity: less than 0.10% difference in the percent positivity is considered No change (equal sign).
- Race and ethnicity data by county and community is not available at this time.
- Change in reporting: MDPH changed their reporting of county data on 8/12/20. Previously, county cases were in the Daily COVID-19 Dashboard report and included probable and confirmed cases. Beginning 8/12/20, county data is now reported in the Weekly COVID-19 report and cases only include confirmed cases. Thus, we are not currently able to show new case county-level data and other county-level data over time for periods prior to 8/12/20.

