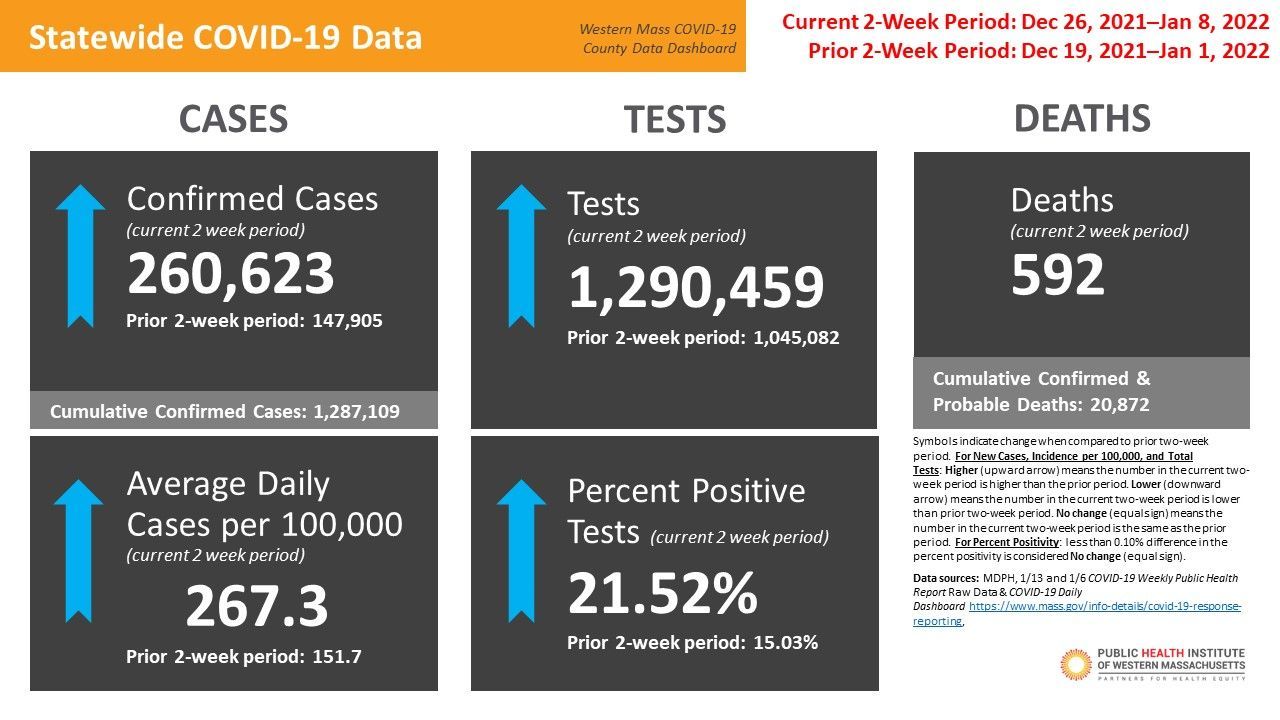
Western MA COVID-19 Data Dashboard
January 14, 2022
Based on best available data as of 1/13/2022


- Download a PDF of the Western MA COVID-19 County Data Dashboard
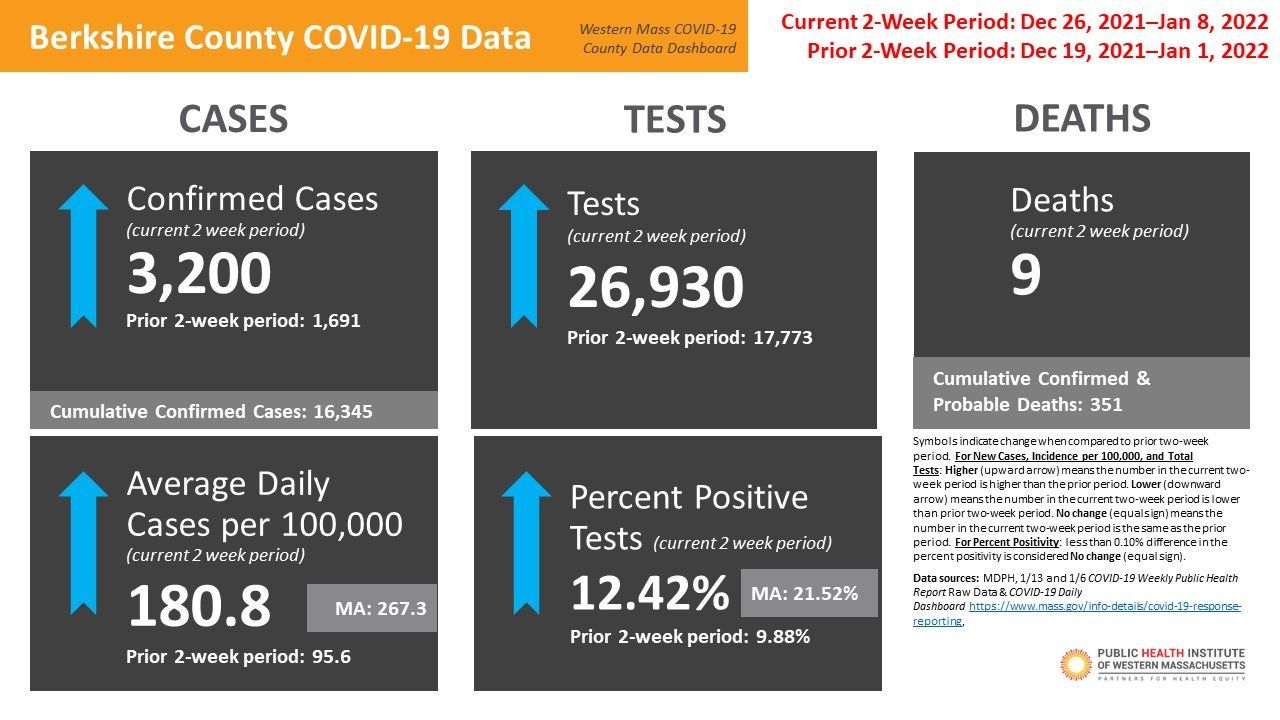
Community-Level COVID-19 Data Over Time
Based on best available data as of 1/13/2022
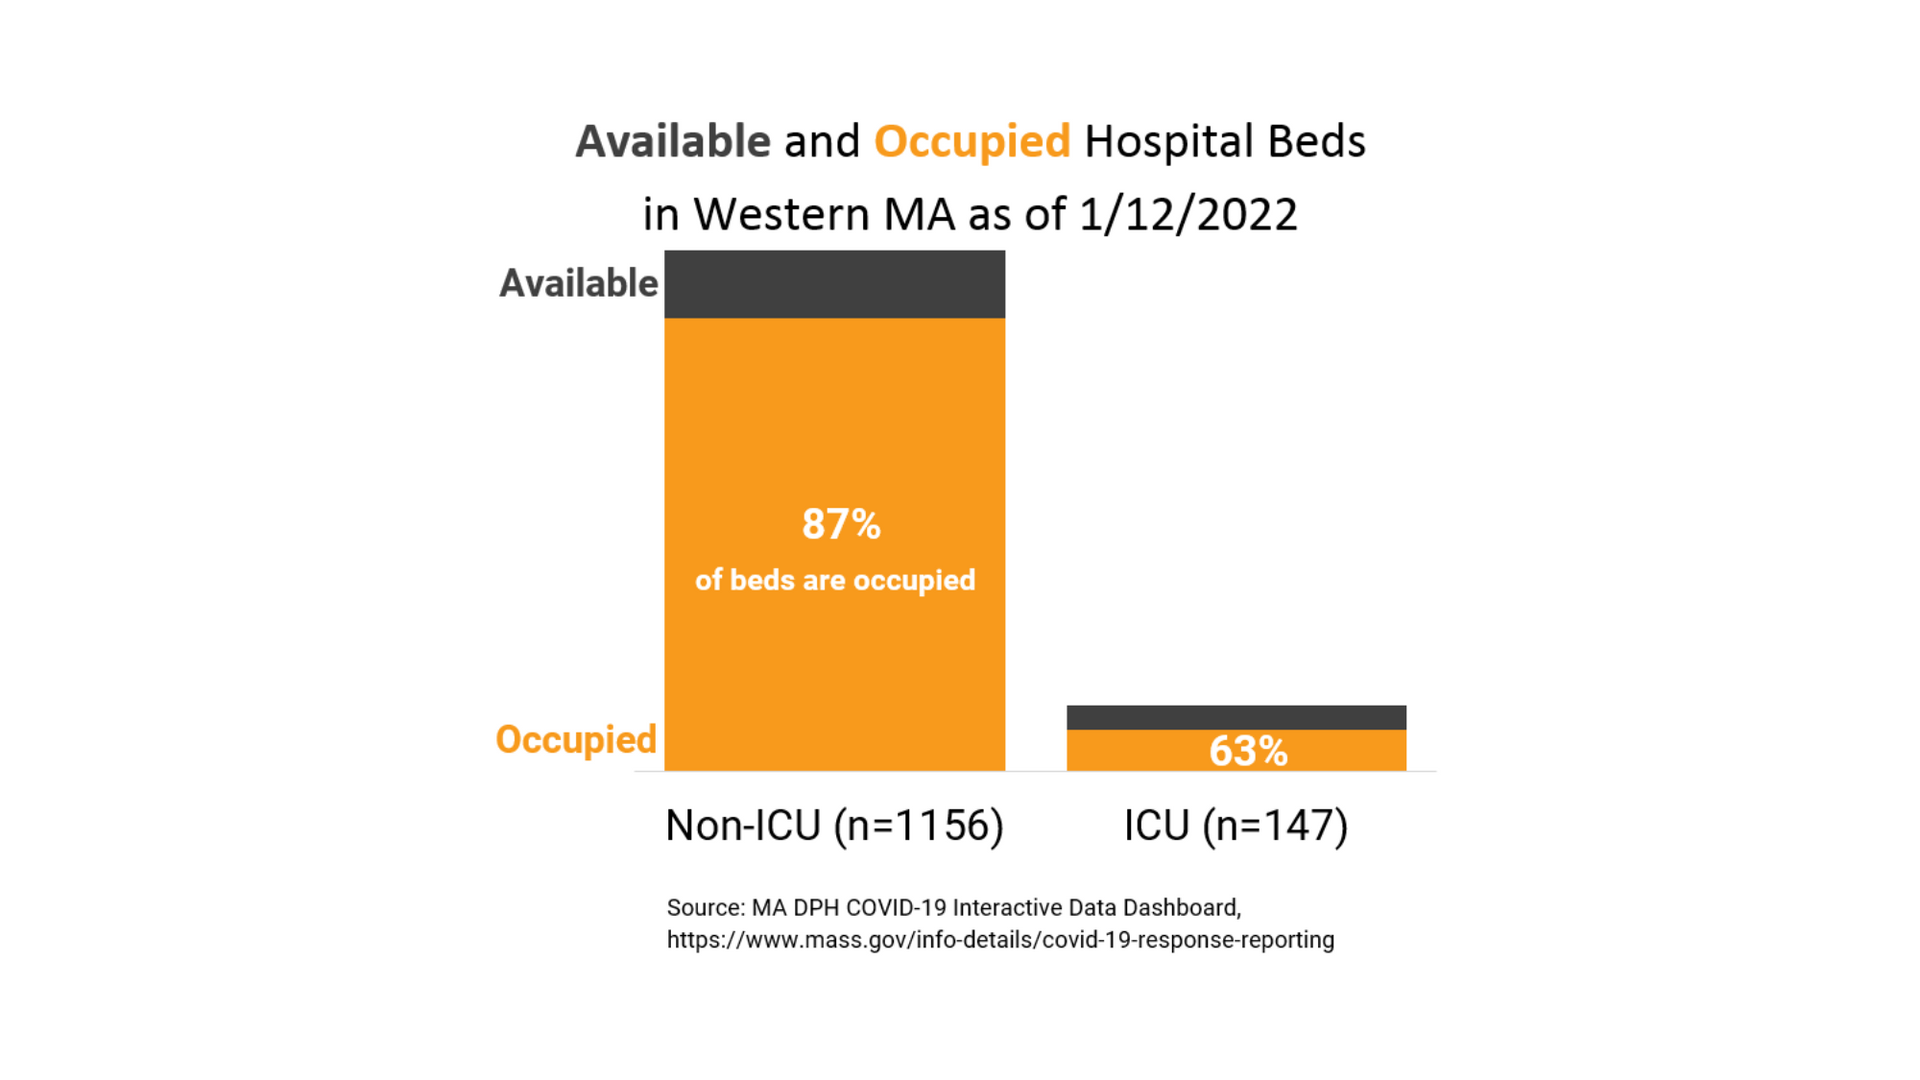
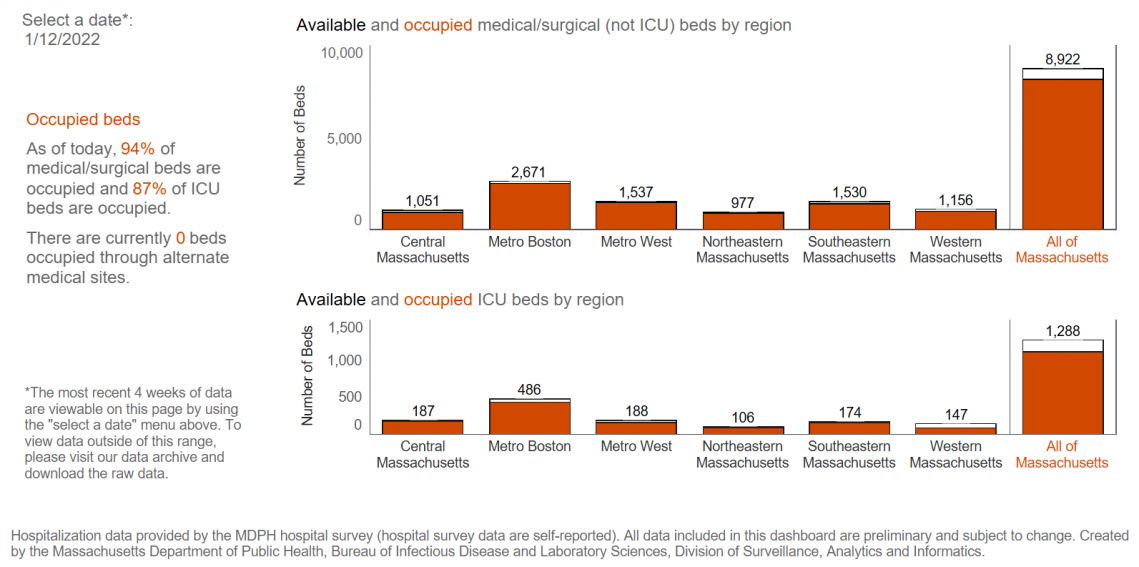
Hospital Capacity by Region
Based on best available data as of 1/13/2022
COVID-19 Vaccine
Based on best available data as of 1/13/22
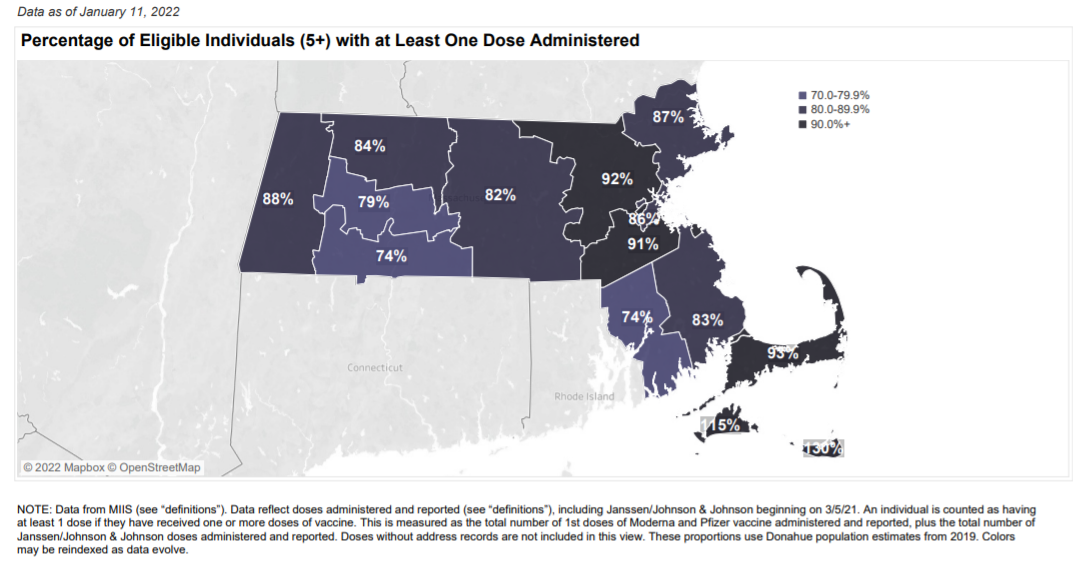
Percentage of Eligible Individuals (5+) with at Least One Vaccine Dose Administered by County of Resident Address
Percentage of Eligible Individuals (5+) Fully Vaccinated by County of Resident Address
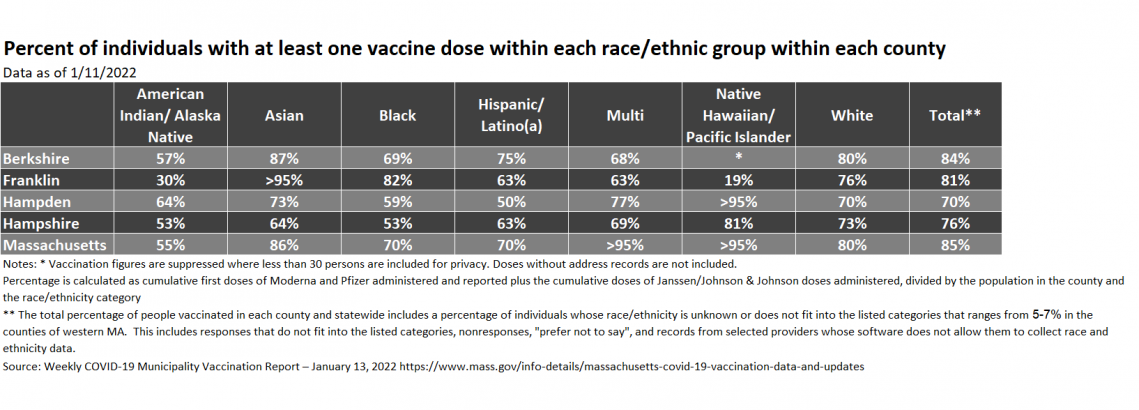
Percentage of All Individuals with at Least One Vaccine Dose within Each Race/Ethnic Group by County of Resident Address
Municipal Vaccine Data
- COVID-19 Vaccine Equity Initiative Data Dashboard: View vaccination data for select cities in MA.
- Massachusetts COVID-19 vaccination data and updates: View state, county, and city-level data, as well as updates about the COVID-19 vaccine in MA.
Data Sources and Notes
- Sources:
- MDPH Weekly COVID-19 Public Health Report. Current two week data is from most recent Public Health Report. Prior two week data is from prior week’s Public Health Report. Please note that there is an overlap in periods as MDPH reports weekly on rolling two week reporting periods, which they use for their comparisons. We report data in this way to be consistent with MDPH reporting.
- MDPH COVID-19 Daily Dashboard. Date corresponding to most recent MDPH Weekly COVID-19 Public Health Report.
- MDPH COVID-19 Interactive Data Dashboard
- MDPH Weekly COVID-19 Vaccination Report
- Comparisons to previous two-week period: Symbols indicate change when compared to prior two-week period. For new cases, incidence per 100,000, and total tests: Higher (upward arrow) means the number in the current two-week period is higher than the prior period. Lower (downward arrow) means the number in the current two-week period is lower than prior two-week period. No change (equal sign) means the number in the current two-week period is the same as the prior period. For percent positivity: less than 0.10% difference in the percent positivity is considered No change (equal sign).
- Race and ethnicity data by county and community is not available at this time.
Change in reporting: MDPH changed their reporting of county data on 8/12/20. Previously, county cases were in the Daily COVID-19 Dashboard report and included probable and confirmed cases. Beginning 8/12/20, county data is now reported in the Weekly COVID-19 report and cases only include confirmed cases. Thus, we are not currently able to show new case county-level data and other county-level data over time for periods prior to 8/12/20.
share this
Related Articles
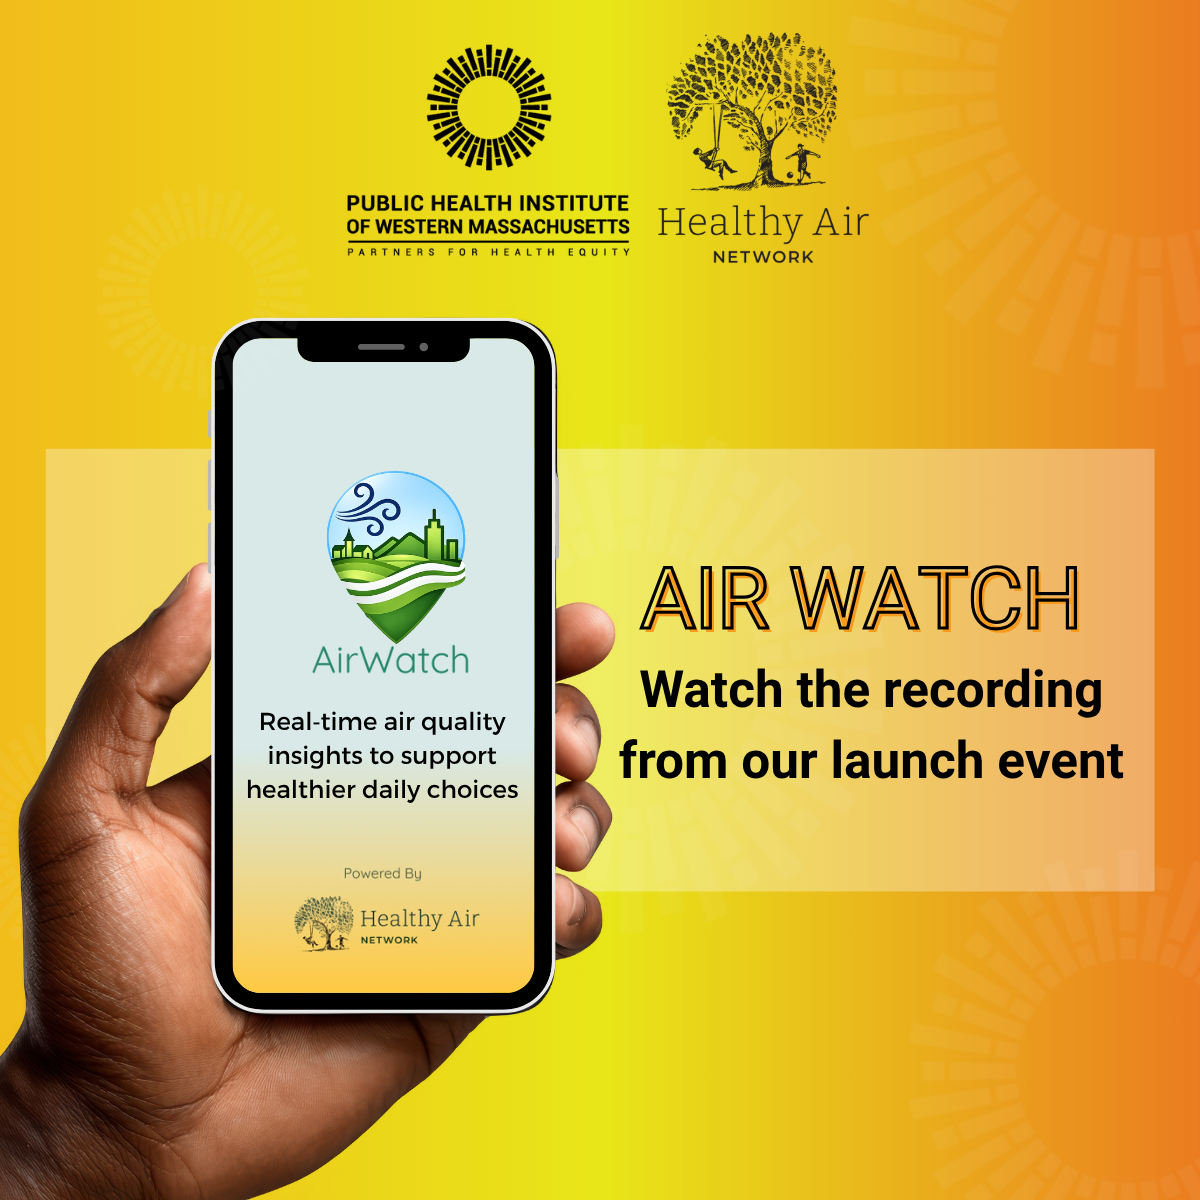
Recording now available from the AirWatch Launch event

The new Air Watch app provides accurate neighborhood data, personalized alerts, and environmental updates in a simple, easy-to-use app.
We’re excited to announce the release of The Health of Western & Central Massachusetts: Key Findings from the 2025 Community Health Needs Assessments. Every three years, hospitals are required to do a Community Health Needs Assessment . While each hospital posts its report publicly and focuses on its specific service area, we recognized the value of stepping back to look at the broader regional picture. This regional health report thoughtfully synthesizes findings across the five counties represented in those service areas. By summarizing shared needs and opportunities at a regional level, we aim to support more coordinated action. Now, more than ever, working and advocating together across the region is essential! We hope this report is useful to your organization and strengthens your collaborative efforts. We would love to hear your feedback and learn how it’s been helpful in your work.