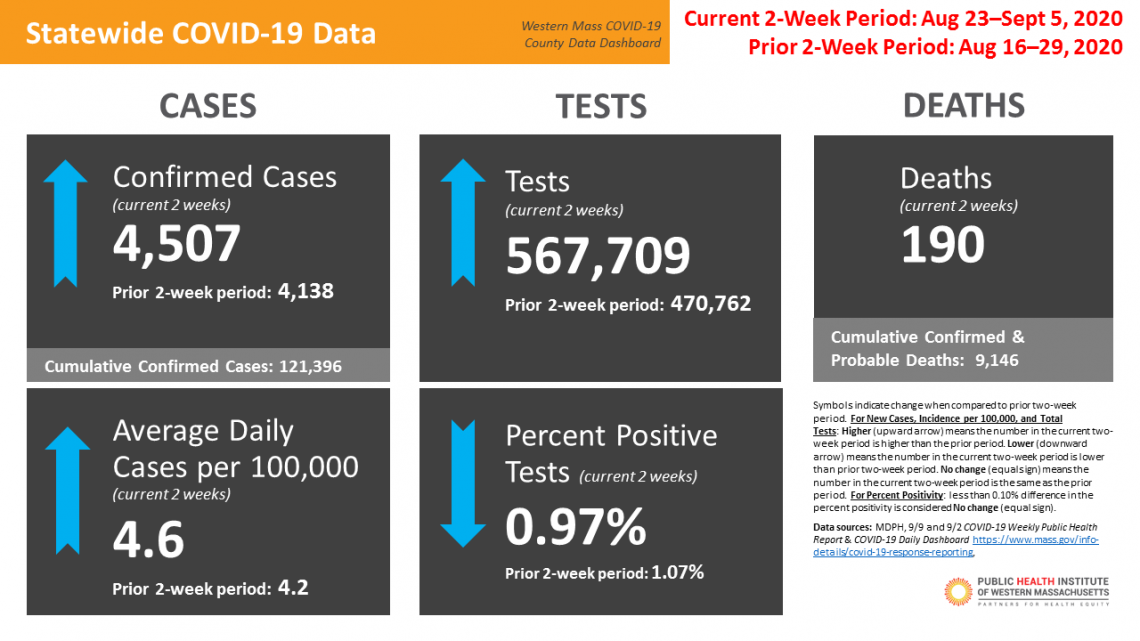
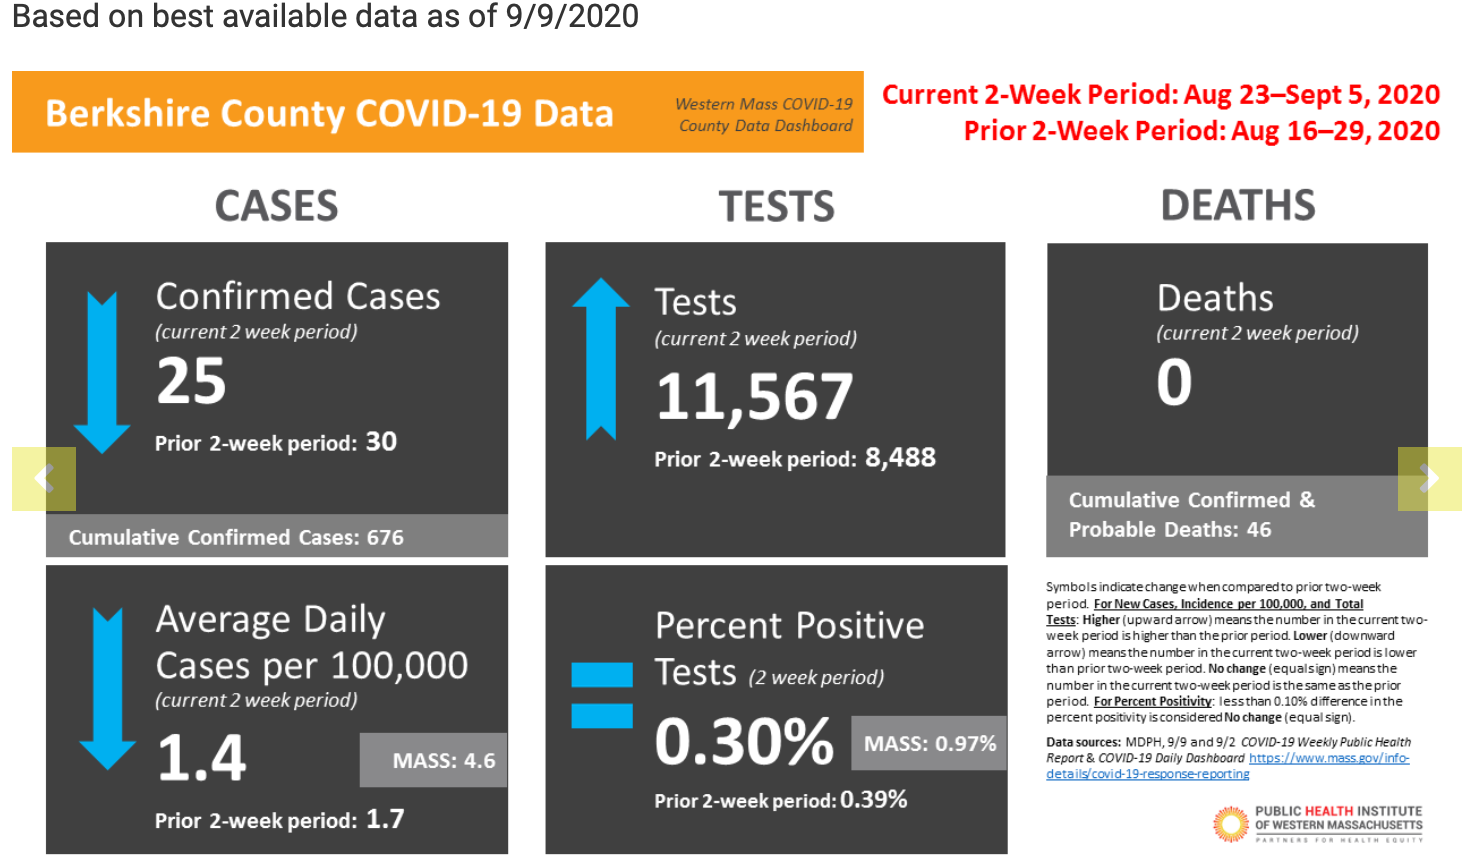
Western MA COVID-19 County Data Dashboard 9/5/2020
September 9, 2020
Download a PDF of the Western MA COVID-19 County Data Dashboard.
Data Sources and Notes
- Sources: MDPH, 9/9, 9/2 and 8/26 COVID-19 Weekly Public Health Report & COVID-19 Daily Dashboard, https://www.mass.gov/info-details/covid-19-response-reporting
- Comparisons to previous two-week period: Symbols indicate change when compared to prior two-week period. For new cases, incidence per 100,000, and total tests: Higher (upward arrow) means the number in the current two-week period is higher than the prior period. Lower (downward arrow) means the number in the current two-week period is lower than prior two-week period. No change (equal sign) means the number in the current two-week period is the same as the prior period. For percent positivity: less than 0.10% difference in the percent positivity is considered No change (equal sign). Please note that two-week periods overlap to be consistent with how the state presents and compares COVID-19 county data overtime in their weekly reports.
- Race and ethnicity data by county and community is not available at this time.
- Change in reporting: MDPH changed their reporting of county data on 8/12/20. Previously, county cases were in the Daily COVID-19 Dashboard report and included probable and confirmed cases. Beginning 8/12/20, county data is now reported in the Weekly COVID-19 report and cases only include confirmed cases. Thus, we are not currently able to show new case county-level data and other county-level data over time for periods prior to 8/12/20.
share this
Related Articles

In 1996, courageous and visionary leaders from competing healthcare institutions created a public health organization to bring people together, secure resources, and convene multiple sectors to focus on community health issues that were not being addressed. That collective vision and action manifested in Partners for a Healthier Community, now the Public Health Institute of Western Massachusetts. Over the past 30 year s, we have strengthened partnerships and uplifted community voices. We are more committed than ever to ensure everyone has what they need to lead a healthy life. Thank you for your decades of partnership and lifetime of active hope.

Online sports betting became legal in Massachusetts in 2022, and now the Legislature is considering a bill (H4431) to legalize internet casino gambling—also known as “iGambling” or “iGaming.” What would more options for 24/7 gambling mean to the public health of our communities? Watch the recording from the 1/9/26 webinar. Speakers included Mark Gottlieb of Northeastern Law’s Public Health Advocacy Institute, Samantha Hamilton of Public Health Institute of Western MA, Victor Ortiz from the MA Dept. of Public Health Office of Problem Gambling, and State Representative Lindsay Sabadosa. The discussion was moderated by Jessica Collins of the Public Health Institute of Western Massachusetts. Webinar Materials recording slides Video shared by Mark Gottlieb- Online Casino Gambling Ad Take Action This month, PLEASE email the MA Legislature’s Committee on Economic Development & Emerging Technologies and ask them to SUPPORT Sen. Keenan’s bill (S.302) to add regulations on sports-betting, AND, OPPOSE H.4431, a bill that would legalize online casino gambling. Instructions & Email Template Links Shared during webinar Read speaker bios Understanding Youth Gambling Behavior in Springfield: Findings from the Springfield Youth Health Survey PHIWM Written Testimony An Act relative to internet gaming An Act addressing economic, health and social harms caused by sports betting The MA Problem Gambling Helpline , 800-327-5050


